4. Curves Transformation
|
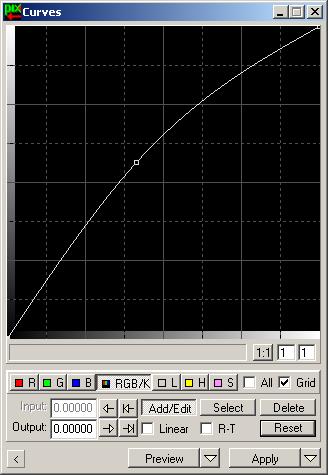
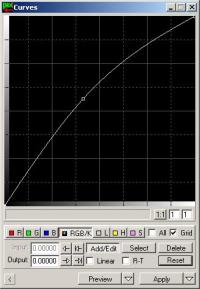
The next step I usually take with PixInsight LE is the curves transformation. This process allows you to change the intensity of the image according with its current brightness. This is done by changing the position of a curve on a graph with original intensity on the horizontal axis and new intensity on the vertical axis, hence the name of the tool. The curve starts off as a straight line, ie. all pixels are unchanged in brightness. Clicking on the curve adds a point to the line, which can be dragged around to increase or decrease the brightness of pixels in the image. It is usual to pull the middle part of the graph upwards, or sometimes, to create an S-shaped line where the upper part goes upwards and the lower part down. What is required depends very much on the image, and much experimentation is usually required. Using the R-T preview can help here, although as with the histogram tool, this is fairly low-quality.
When using the PixInsight curves dialog box the mouse starts in "Add/Edit" points mode. To remove a point click the Delete button and then click a point with the mouse. To remove all points on the current curve, click Reset, and to remove all points on all lines click Reset whilst holding down Ctrl.
|
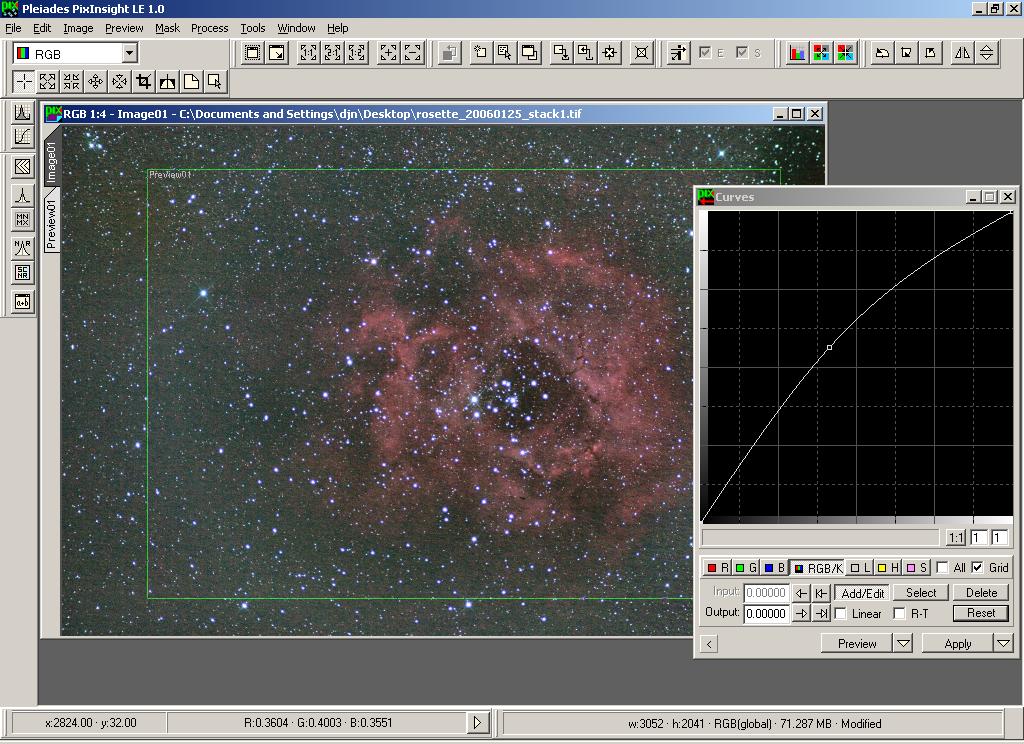
The PixInsight LE curves tool has seven separate curves that can be adjusted. Most are relevant for colour images only -- if you are processing a black and white image you should use the RGB/K channel, which adjusts the intensity of the whole image, otherwise you can use the following:Red channel(R) Green channel(G), Blue channe(B), Combined(RGB/K), Luminance(L), Hue(H) and Saturation(S).
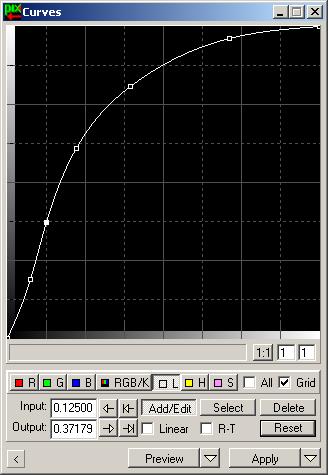
I usually start by adjusting the luminance. Here you can see I have pulled the luminance curve up quite a lot, which is normally surprisingly effective with colour images.
You can also see that I have used five separate points on the curve. This is to constrain the curve into lying where I want it to on the graph. Sometimes the curve will move in some unwanted ways -- just try it and you'll get the hang of it!
|
|
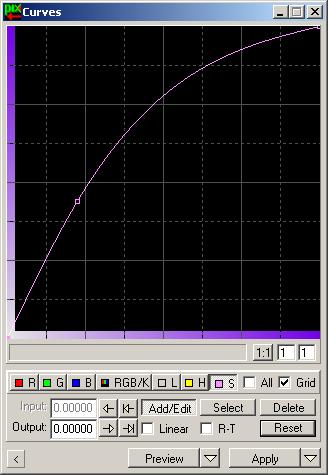
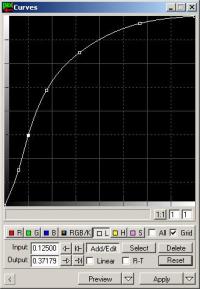
Next, I generally find that an increase in saturation is necessary when increasing luminance. Here I have made a gentle adjustment using only one point.
Note, I haven't applied any changes yet, I am adjusting all curves on the dialog before I apply them to the preview to see how they come out.
|
|
|
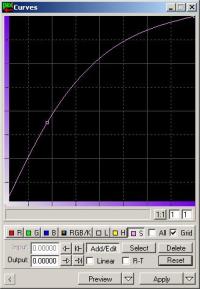
Sometimes it's necessary to adjust the individual Red, Green, and Blue curves but on this occasion I am going to simple do it all at once using the RGB/K curve.As you can see, I'm only making a small adjustment because most of the required increase in intensity is taken care of using the Luminance curve in this case.
|
|
|
|
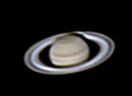
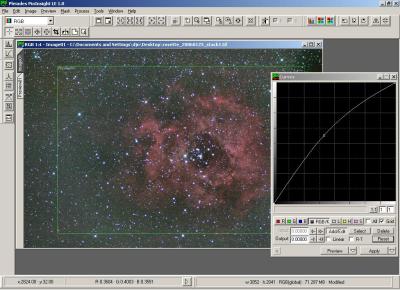
Here is the result of applying the curves to the image. In fact I tried several variations and applied them to the Preview image before I was happy. This image shows that I have brought back some of my lighter background, which I subtracted early on. Perhaps I was too cautious in reducing the level of the background image (remember those 0.8, 0.9, 0.9 multipliers in the Pixel Math box?) I will remedy this later.
|
|
|
|
 |
|
All text and images copyright and may not be used without permission
|
|